Tuesday, 28 March 2017

Trading GBP/USD amid US Consumer Confidence News

The Great Britain Pound (GBP) inched higher against the US Dollar (USD) on Tuesday, increasing the price of GBPUSD to more than 1.2550 ahead of the US consumer confidence news. The technical bias has turned bullish because of a higher high in the recent upside rally.
US Consumer Confidence report

US Consumer Confidence

The Consumer Board of the United States is due to release the consumer confidence data today. According to the average forecast of different economists, the consumer confidence registered a reading of 113.8 points in March as compared to 114.8 points in the month before.
If the customers are confident about their future, they will spend more and the economy will grow. Otherwise, they will save money and the economy will suffer.
The Consumer Confidence released by the Conference Board captures the level of confidence that individuals have in economic activity.

How to Trade Today’s Consumer Confidence News?

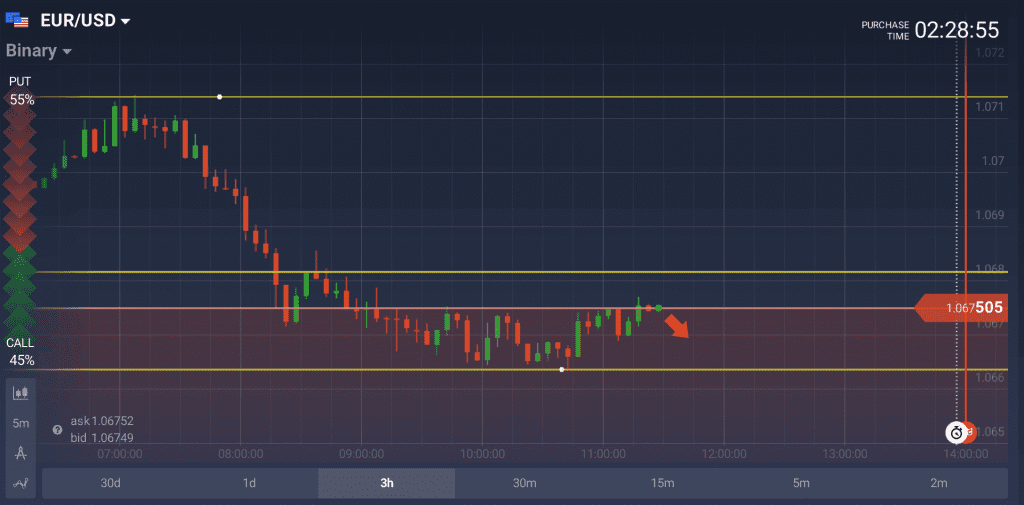
  • Buying the GBPUSD put options near current levels can be a good strategy if the consumer confidence data comes better than forecast.
Put options
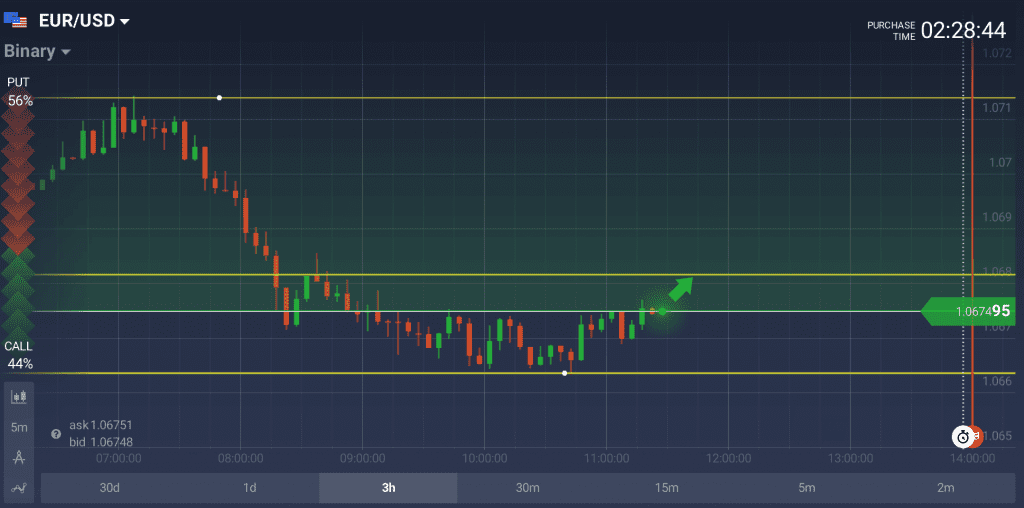
  • Alternatively, buying the GBPUSD call options may be a good move if the consumer confidence misses the average projections of economists.
Call options

Technical Analysis

As of this writing, the pair is being traded near 1.2572. A support can be noted around 1.2562 (an immediate trendline support) ahead of 1.2519 (the 50% fib level) and then 1.2500 (the confluence of lower trendline as well as horizontal support area) as demonstrated in the given below hourly chart.
GBP/USD Technical Analysis
On the upside, a hurdle may be noted around 1.2581 (the trendline resistance area as demonstrated with pink color in the above chart) ahead of 1.2614 (the high of recent upside wave) and then 1.2700 (the psychological number). The technical bias shall remain bullish as long as the 1.2500 support area is intact.

How GBP/USD Reacted to Past Consumer Confidence Releases?

The cable fell by almost 55 pips after the release of last consumer confidence data in February as the consumer board showed upbeat consumer confidence reading of 114.8 points vs the average forecast of 111.0 points.
January Consumer Confidence Release
February's Consumer Confidence release
The pair however rose by more than 35 pips after the release of January’s consumer confidence data as the actual outcome came at 111.6 points against the forecast of 113.0 points.

iv>

Thursday, 23 March 2017

AUD/USD Poised for Breakout Ahead of US Jobless Claims

The Australian Dollar (AUD) inched lower against the US Dollar (USD) on Thursday, decreasing the price of AUDUSD to less than 0.7650 ahead of the US Initial Jobless Claims data. The technical bias shall remain bullish because of a higher high in the ongoing upside rally.

US Initial Jobless Claims

The US labor department is scheduled to release the Initial Jobless Claims data today during the US trading session. According to the average forecast of different economists, the jobless claims registered 240k reading this week as compared to 241k in the week before.
Initial Jobless claimes
The Initial Jobless Claims released by the US Department of Labor is a measure of the number of people filing first-time claims for state unemployment insurance. In other words, it provides a measure of strength in the labor market.
A larger than expected number indicates weakness in this market which influences the strength and direction of the US economy. Generally speaking, a decreasing number should be taken as positive or bullish for the USD.

How to Trade Today’s Jobless Claims Report

  • Buying the AUDUSD put options can be a good strategy if the US initial jobless claims data exceeds the average projections of economists.
Put Option
  • Alternatively, buying the AUDUSD call options may be a good move if the jobless claims figure misses the forecast.
Call options
Technical Analysis
As of this writing, the pair is being traded around 0.7637. A support can be noted around 0.7625, a short term horizontal support ahead of 0.7450-0.7475, the confluence of 50% fib level as well as another trendline support area and then 0.7159, the swing low of the last major downside move.
AUD/USD Technical Analysis
On the upside, a hurdle can be noted near 0.7731, an immediate trendline resistance ahead of 0.7770, another trendline resistance zone as demonstrated with red color in the given above daily chart.  A break and daily closing above the 0.7770 trendline resistance shall incite renewed buying interest, validating a move towards the 0.8000 resistance zone. The technical bias shall remain bullish as long as the 0.7490 support area is intact.

How AUDUSD Reacted on Past Jobless Claims Releases?

Last time the labor department released its jobless claims data on 16th March, 2017. The AUD/USD pair fell by 10 pips after the release of last jobless claims figure as the actual reading was upbeat i.e. 241k v 240k.
The pair fell by more than 50 pips after the release of March 9, 2017 report as the actual reading came out 243k vs the 223k forecast.

9 March initial jobless claims report
Previous release

Monday, 13 March 2017

EUR/USD Continues Winning Streak ahead of Draghi’s Speach. Live at 13:30 GMT

The Euro (EUR) extended upside movement against the US Dollar (USD) on Monday, increasing the price of EUR/USD to more than 1.0700 ahead of the ECB’s head Mario Draghi’s speach. The technical bias remains bearish because of a lower high in the recent upside rally.
ECB President Draghi Speaks 13:30 gmt

How to Trade today’s Draghi Speach?

  • Buying EUR/USD put options above the aforementioned support levels can be a good strategy if Draghi paints unfavorable picture about the Eurozone’s economy.
Put Option
  • Alternatively, buying EUR/USD call options above the aforementioned resistance levels can be a good strategy if he hints at potential rate hike in coming months.
Call option

ECB’s Mario Draghi Speach

The European Central Bank (ECB) head Mario Draghi is due to speak today during the US trading session. The ECB president is expected to share key information about the future monetary policy outlook of the European Union (EU). Investors will be monitoring Draghi’s remarks very closely, a hawkish stance shall lead to sharp rally in the EUR/USD pair and vice versa.

Technical Analysis

As of this writing, the pair is being traded around 1.0701. A support may be seen near 1.0618, the trendline support area as demonstrated in the given below daily chart with brown color. A break and daily closing below the 1.0618 trendline support shall incite renewed selling interest, validating a move towards the 1.0400 support zone which is a psychological number.
EUR/USD Technical analysis
On the upside, the pair is expected to face a hurdle near 1.0710, the 38.2% fib level ahead of 1.0819, the 50% fib level and then 1.0990, the upper trendline resistance as marked with red color in the above chart. The technical bias shall remain bearish as long as the 1.0819 resistance zone is intact.

How EUR/USD Reacted to Draghi speeches In Past?

The EUR/USD rallied last week after the ECB’s head Mario Draghi remarks as he painted a very positive picture about the Eurozone economy. He said the painful monetary policy instruments adopted by his team are finally showing the desired outcomes.
The pair however fell sharply after the Draghi’s speech on February 6th, 2017 after he said the central bank might go for more harsh monetary policy tools including the negative benchmark interest rate.

Thursday, 2 March 2017

USD/CAD Continues Winning Streak Ahead of Canada’s GDP News

The US Dollar (USD) inched higher against the Canadian Dollar (USD) on Thursday, increasing the price of USD/CAD to more than 1.3350 ahead of the Canada’s Gross Domestic Product (GDP) news release. The technical bias remains bearish because of a lower low in the recent downside move.

Technical Analysis

As of this writing, the pair is being traded around 1.3349. A support may be seen near 1.3300, the trendline support area as demonstrated in the given below daily chart with brown color. A break and daily closing below the 1.3300 trendline support shall incite renewed selling interest, validating a move towards the 1.3067 support zone which is another critical support zone.


USD/CAD Technical Analysis
Canadian Dollar becomes stronger – last 2 months the oil price increases

On the upside, the pair is expected to face a hurdle near 1.3357, the intraday high of yesterday ahead of 1.3387, the high of last major upside rally and then 1.3600, the high of 28th December, 2016 as marked with red color in our chart. The technical bias shall remain bearish as long as the 1.3600 resistance zone is intact.

Canada’s GDP News

Statistics Canada is due to release the Canada’s Gross Domestic Product (GDP) data today at 13:30 GMT during New York trading session. According to the average forecast of different economists, the Canadian GDP remained 2% in January as compared to 3.5% in the same month of the year before. Generally speaking, higher GDP figure is considered good for the economy and vice versa.
Canada GDP 2 March

How USD/CAD Reacted to Past GDP Release?

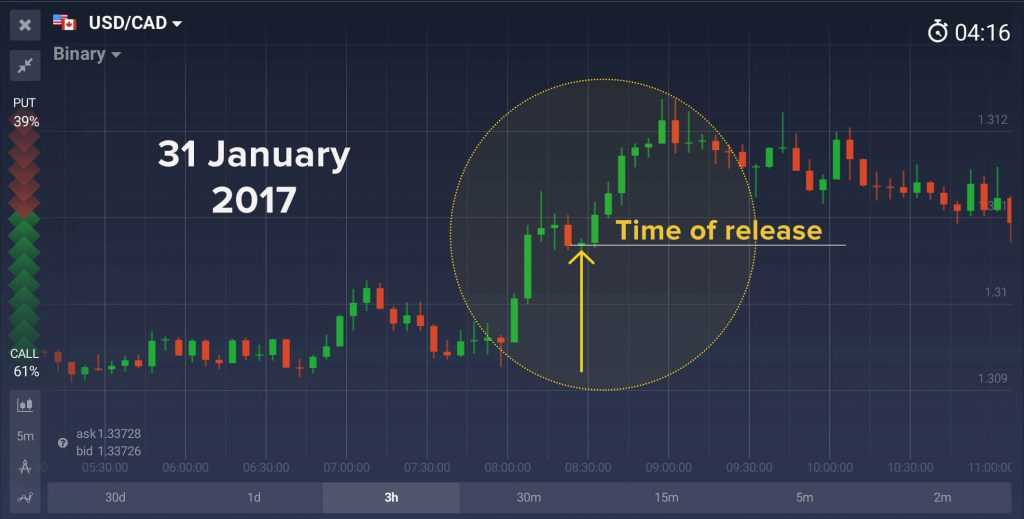
Last time when the GDP data was released by the Statistics Canada, the actual reading came out to be 0.4% as compared to the forecast of 0.3%, up beating the average forecast of economists. As expected, the USD/CAD plunged nearly 20 pips before and 20 pips soon after the release. Previous GDP Release


USD/CAD after GDP release in January
USD/CAD movements before and after Canada GDP release in January

How to Trade today’s New Home Sales Data?

Today if the GDP data comes better than forecast, then USDCAD is likely to appear near support line:
Put options - Canada GDP
Alternatively, if the actual figure comes worse than forecast, then buying call options close to the support level can be a good strategy:
Call Options CAD GDP release