The Euro (EUR) inched lower against the US Dollar (USD) on Thursday, decreasing the price of EUR/USD to less than 1.0950 ahead of the ECB monetary policy announcement which is considered a key gauge for current economic conditions.
The technical bias remains bullish because of a higher high in the recent upside wave.
Technical Analysis
As of this writing, the pair is being traded around 1.0904. A hurdle may be noted near 1.0916, an immediate trendline resistance ahead of 1.0950, the high of the last major upside move and then 1.1000, a major psychological number on all timeframes. A break and hourly closing above the 1.1000 resistance shall incite renewed buying interest, validating a move towards the 1.1065 resistance which is another major horizontal resistance area.
On the downside, a support may be seen near 1.0885, the confluence of two trendlines as demonstrated in the given above hourly chart with black and red colors ahead of 1.0815, the confluence of 50% fib level as well as lower trendline and then 1.0681, the low of the last major downside move. The technical bias shall remain bullish as long as the 1.0681 support zone is intact.
How EUR/USD Reacted on ECB Monetary Policies in Past?
EUR/USD didn’t show any noticeable volatility after the release of last few ECB monetary policies as the central bank kept the benchmark interest rate as well as deposit rate unchanged at 0% and -0.4% respectively.
How to Trade Today’s Interest Rate Decision?
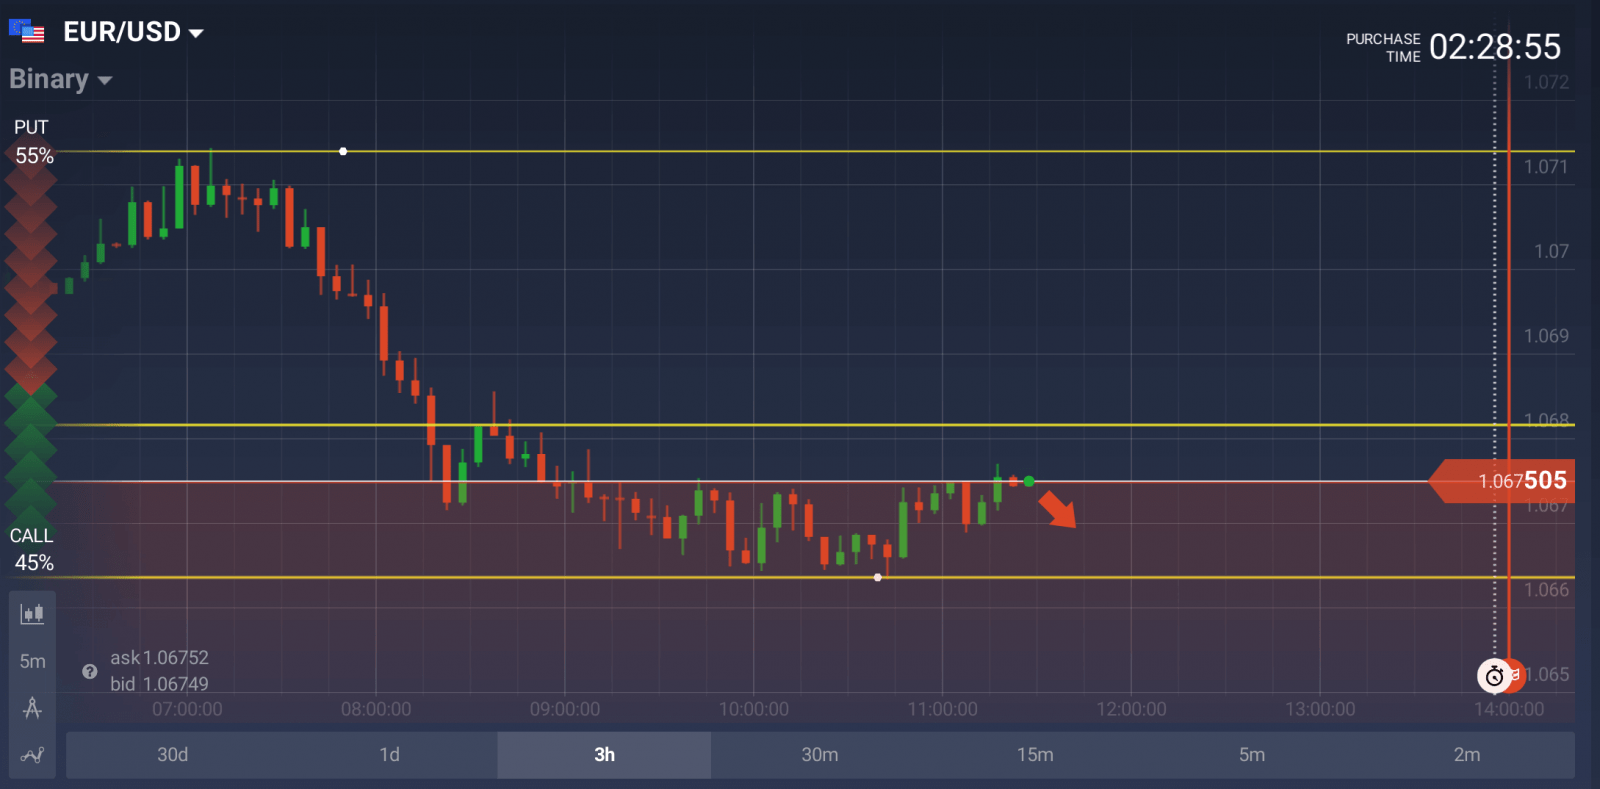
Buying the EURUSD put options near current levels can be a good strategy if the ECB unexpectedly reduces its interest/deposit rate.
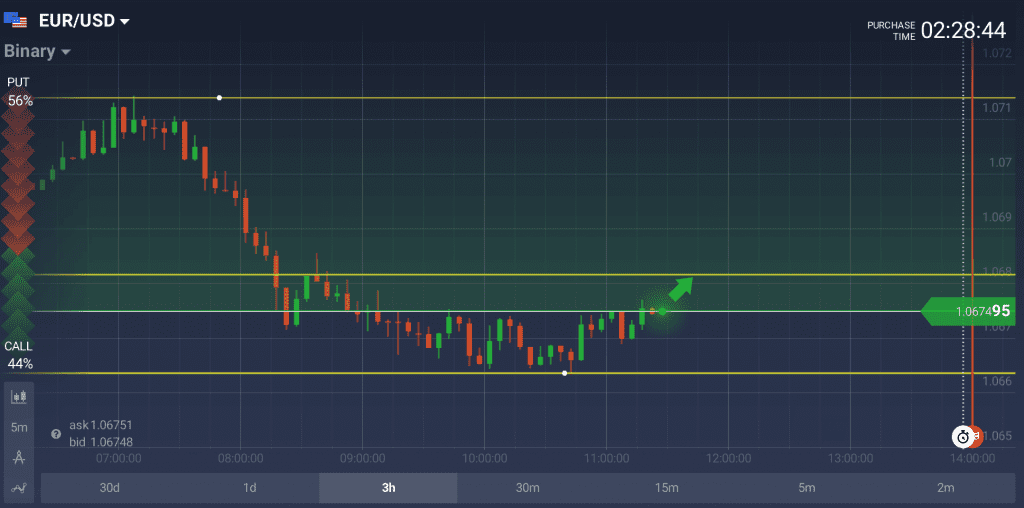
Alternatively, buying the EURUSD call options may be a good move if the ECB unexpectedly increases its interest/deposit rate.
What Assets to Trade?
In addition to EUR/USD, trading EUR/GBP, EUR/AUD, EURJPY and EURCAD can also be a good move as the aforementioned pairs are highly reactive to the ECB monetary policy announcement.
Anthem Inc. is expected to announce its Q1/17 earnings on 26 April 2017 before market open. According to the community of experts, ANTM stock is not only destined for long-term growth but also offers an opportunity to gain short-term speculative profit.
YTD performance of ANTM and S&P 500
Whether it is true or not, we will know after taking a closer look at the company’s profile. Year-to-date, Anthem confidently outperformed the HMO industry, showing 14.8% against 5.1%. Ranked “Buy” by Zacks, the company can boast a positive earnings ESP of 7.67%.
ANTM Daily Chart
Performance indicators
52 Week High-Low
$170.79 – $114.85
Dividend / Div Yld
$2.60 / 1.55%
EV/EBITDA Annual
5.66
Consensus EPS forecast Q1/17
$3.85
Reported EPS Q1/16
$3.46
Forward PE
14.56
Reasons to invest in ANTM
Positive earnings sentiment. Right now, experts believe ANTM has all the chances of returning higher than previously expected results in the Q1/17. Four positive revisions of the company’s EPS in the last 60 days can be a good proof of that.
Four Zacks experts believe ANTM will perform better than expected in Q1/17
Price impact. Bullish investors love it when company’s stock is growing, and they especially love it when the stock is growing fast. This is exactly what happened with Anthem Inc. in a year-to-date perspective. While the categorized industry gained only 5.1% since the beginning of this year, the company grew 14.8%. The experts attribute the solid growth to the diverse portfolio, deliberate capital management, and strategic acquisitions.
ANTM stock performance in 2017
Growing clientele. The increase in revenue and stock prices is a result of a growing membership base, at least to a certain extent. Due to strategic acquisitions and Medicaid expansion medical enrollment was equal to 39.9 million people (as of 31 December 2016), a 3.4% increase YoY. The introduction of Affordable Care Act is expected to increase the number of medical memberships to 40.1–40.3 million (or 0.7% YoY) members in 2017.
Anthem Inc. membership base
Dividends and repurchases. Anthem can afford consistent dividend payouts and a massive share repurchase program thanks to its strong capital and cash position. With $3.5 billion excessive operating cash flow expected in 2017 the company is well positioned to buy back its shares and boost shareholder value. 2011 was the year when cash dividends have first been introduced. In the following five years, the dividend rose 160% and still continues to grow.
Stock performance. The company has an earnings ESP of +7.79% and ranked “Buy” by Zacks. This is a good enough reason to believe Anthem Inc. stock prices to climb even higher in the near future. Positive earnings surprise prediction means the company is doing better than expected and is anticipated to deliver more for every dollar invested. Professional investors always pay close attention to this metric.
Risks to consider
Even the most successful and stable companies face serious risks operating in the harsh market environment. Anthem Inc. is no exception. Possible headwinds include both internal and external factors.
Unsuccessful Anthem-Cigna merger. Recent merger proposal has been blocked by the regulators under the pretext of increased consolidation in the health insurance industry. As a result of the unsuccessful deal Anthem now owes $1.85 billion in severance charges to Cigna. Not only the rejection hampered Anthem’s face value but also deprived the company of future growth opportunities. Yet only time will tell how hard the company has been struck by the regulators’ decision.
Anthem and Cigna members by market segments
Declining investment income. In 2015, the company witnessed a sharp decline in the net investment income to $677.6 million (6.5% in YoY terms). This was due primarily to decreasing interest rates. In 2017, the investment income is estimated to be $740 million.
U.S. interest rates over the last two centuries
Debt burden. Increasing debt-to-capital ratio has become a major problem for Anthem over the past few years. Sustainable liquidity of the company might be at risk due to high leverage ratio.
Year
2009
2010
2011
2012
2013
2014
2015
2016
Debt-to-capital ratio
25.3%
27.3%
29.6%
38.6%
36.9%
37.6%
40.8%
36.4%
Though not yet alarming, high debt-to-capital ratio can become a serious problem for ANTM in the coming years. At the same time, investors believe the multiple can be expected to decrease from 2017 onward.
Conclusion
The outlook for the company is moderate to positive with high enough chances of stock prices to go up on the date of the earnings report release. Year-to-date results are impressive. Positive earnings revisions push the stock prices up. And the overall picture, yet bedeviled by debt burden and unsuccessful merger with Cigna, looks pretty positive.
Analyst price target in the next 12 months
Short-term fluctuations in stock prices are not always connected to the long-term financial performance, however, earnings reports bring them together. On 26 April 2017 Anthem stock price will depend heavily on the results of the Q1/17 earnings report. Should the company impress the public with above the average performance and exceed experts’ expectations, ANTM shares might surge in the beginning of the trading session. In case the actual figures are going to fall short of the estimates quite the opposite is well possible.
US Building Permits Report is to be published today at 12:30 GMT time.
Gold inched lower on Tuesday, decreasing the price of yellow metal to less than $1300.00 an ounce ahead of the US building permit news. The technical bias remains bullish because of a higher high in the recent upside move.
Analysis of Gold Chart
As of this writing, the precious metal is being traded near $1282 an ounce. A support may be noted around $1277, the 38.2% fib level ahead of $1274, the pink trendline support and then $1250, a key horizontal support as well as psychological number.
Gold H1 Chart
On the upside, a hurdle can be noted near $1290, the trendline resistance area as demonstrated with black color in the given above chart. A break and hourly closing above the black trendline shall trigger renewed buying interest, validating a rally towards the $1321 resistance area. The technical bias shall remain bullish as long as the $1250 support area is intact.
How Gold Reacted on Past Building Permit News Releases?
Gold inched higher by almost $2 after the release of building permit report on March 16th, 2017. The actual outcome was 1.213 as compared to the forecast of 1.260, as per the March building permit report.
March 16th resultsGold chart after March 16th building permits report
The yellow metal however fell by around $5 after the release of February’s building permit report. The actual outcome was 1.3 as compared to the forecast of 1.2 points.
How to Trade today’s Building Permit News
Buying the Gold call options can be a good strategy if the US building permit data comes worse than the average projections of economists.
Alternatively, buying the gold put options may be a good strategy if the US building permit data remains above the average forecast.
What Assets to Trade?
In addition to Gold, trading EUR/USD, GBP/USD, USD/CHF, NZD/USD and AUD/USD can also be a good strategy as the aforementioned pairs are highly reactive to the US building permit report.
The Great Britain Pound (GBP) inched higher against the US Dollar (USD) on Tuesday, increasing the price of GBPUSD to more than 1.2550 ahead of the US consumer confidence news. The technical bias has turned bullish because of a higher high in the recent upside rally.
US Consumer Confidence
The Consumer Board of the United States is due to release the consumer confidence data today. According to the average forecast of different economists, the consumer confidence registered a reading of 113.8 points in March as compared to 114.8 points in the month before.
If the customers are confident about their future, they will spend more and the economy will grow. Otherwise, they will save money and the economy will suffer.
The Consumer Confidence released by the Conference Board captures the level of confidence that individuals have in economic activity.
How to Trade Today’s Consumer Confidence News?
Buying the GBPUSD put options near current levels can be a good strategy if the consumer confidence data comes better than forecast.
Alternatively, buying the GBPUSD call options may be a good move if the consumer confidence misses the average projections of economists.
Technical Analysis
As of this writing, the pair is being traded near 1.2572. A support can be noted around 1.2562 (an immediate trendline support) ahead of 1.2519 (the 50% fib level) and then 1.2500 (the confluence of lower trendline as well as horizontal support area) as demonstrated in the given below hourly chart.
On the upside, a hurdle may be noted around 1.2581 (the trendline resistance area as demonstrated with pink color in the above chart) ahead of 1.2614 (the high of recent upside wave) and then 1.2700 (the psychological number). The technical bias shall remain bullish as long as the 1.2500 support area is intact.
How GBP/USD Reacted to Past Consumer Confidence Releases?
The cable fell by almost 55 pips after the release of last consumer confidence data in February as the consumer board showed upbeat consumer confidence reading of 114.8 points vs the average forecast of 111.0 points.
The pair however rose by more than 35 pips after the release of January’s consumer confidence data as the actual outcome came at 111.6 points against the forecast of 113.0 points.
The Australian Dollar (AUD) inched lower against the US Dollar (USD) on Thursday, decreasing the price of AUDUSD to less than 0.7650 ahead of the US Initial Jobless Claims data. The technical bias shall remain bullish because of a higher high in the ongoing upside rally.
US Initial Jobless Claims
The US labor department is scheduled to release the Initial Jobless Claims data today during the US trading session. According to the average forecast of different economists, the jobless claims registered 240k reading this week as compared to 241k in the week before.
The Initial Jobless Claims released by the US Department of Labor is a measure of the number of people filing first-time claims for state unemployment insurance. In other words, it provides a measure of strength in the labor market.
A larger than expected number indicates weakness in this market which influences the strength and direction of the US economy. Generally speaking, a decreasing number should be taken as positive or bullish for the USD.
How to Trade Today’s Jobless Claims Report
Buying the AUDUSD put options can be a good strategy if the US initial jobless claims data exceeds the average projections of economists.
Alternatively, buying the AUDUSD call options may be a good move if the jobless claims figure misses the forecast.
Technical Analysis
As of this writing, the pair is being traded around 0.7637. A support can be noted around 0.7625, a short term horizontal support ahead of 0.7450-0.7475, the confluence of 50% fib level as well as another trendline support area and then 0.7159, the swing low of the last major downside move.
On the upside, a hurdle can be noted near 0.7731, an immediate trendline resistance ahead of 0.7770, another trendline resistance zone as demonstrated with red color in the given above daily chart. A break and daily closing above the 0.7770 trendline resistance shall incite renewed buying interest, validating a move towards the 0.8000 resistance zone. The technical bias shall remain bullish as long as the 0.7490 support area is intact.
How AUDUSD Reacted on Past Jobless Claims Releases?
Last time the labor department released its jobless claims data on 16th March, 2017. The AUD/USD pair fell by 10 pips after the release of last jobless claims figure as the actual reading was upbeat i.e. 241k v 240k.
The pair fell by more than 50 pips after the release of March 9, 2017 report as the actual reading came out 243k vs the 223k forecast.
The Euro (EUR) extended upside movement against the US Dollar (USD) on Monday, increasing the price of EUR/USD to more than 1.0700 ahead of the ECB’s head Mario Draghi’s speach. The technical bias remains bearish because of a lower high in the recent upside rally.
How to Trade today’s Draghi Speach?
Buying EUR/USD put options above the aforementioned support levels can be a good strategy if Draghi paints unfavorable picture about the Eurozone’s economy.
Alternatively, buying EUR/USD call options above the aforementioned resistance levels can be a good strategy if he hints at potential rate hike in coming months.
ECB’s Mario Draghi Speach
The European Central Bank (ECB) head Mario Draghi is due to speak today during the US trading session. The ECB president is expected to share key information about the future monetary policy outlook of the European Union (EU). Investors will be monitoring Draghi’s remarks very closely, a hawkish stance shall lead to sharp rally in the EUR/USD pair and vice versa.
Technical Analysis
As of this writing, the pair is being traded around 1.0701. A support may be seen near 1.0618, the trendline support area as demonstrated in the given below daily chart with brown color. A break and daily closing below the 1.0618 trendline support shall incite renewed selling interest, validating a move towards the 1.0400 support zone which is a psychological number.
On the upside, the pair is expected to face a hurdle near 1.0710, the 38.2% fib level ahead of 1.0819, the 50% fib level and then 1.0990, the upper trendline resistance as marked with red color in the above chart. The technical bias shall remain bearish as long as the 1.0819 resistance zone is intact.
How EUR/USD Reacted to Draghi speeches In Past?
The EUR/USD rallied last week after the ECB’s head Mario Draghi remarks as he painted a very positive picture about the Eurozone economy. He said the painful monetary policy instruments adopted by his team are finally showing the desired outcomes.
The pair however fell sharply after the Draghi’s speech on February 6th, 2017 after he said the central bank might go for more harsh monetary policy tools including the negative benchmark interest rate.